MACD bullish and bearish divergence with price is one of the factors that traders use to judge the end of a trend or strong directional move. Usually some kind of tradable reversal takes place after a bullish or bearish divergence between the MACD indicator and price. We will look at a couple of examples from the current DAX 30 minutes chart, the most recent of which is still unravelling as I write.
In the 30 minute chart above we can see a perfect illustration of a bullish divergence between the MACD technical indicator and price. These are fairly common patterns and certainly ones for every trader to be aware of as they often produce excellent trading opportunities.
What is an MACD divergence with price?
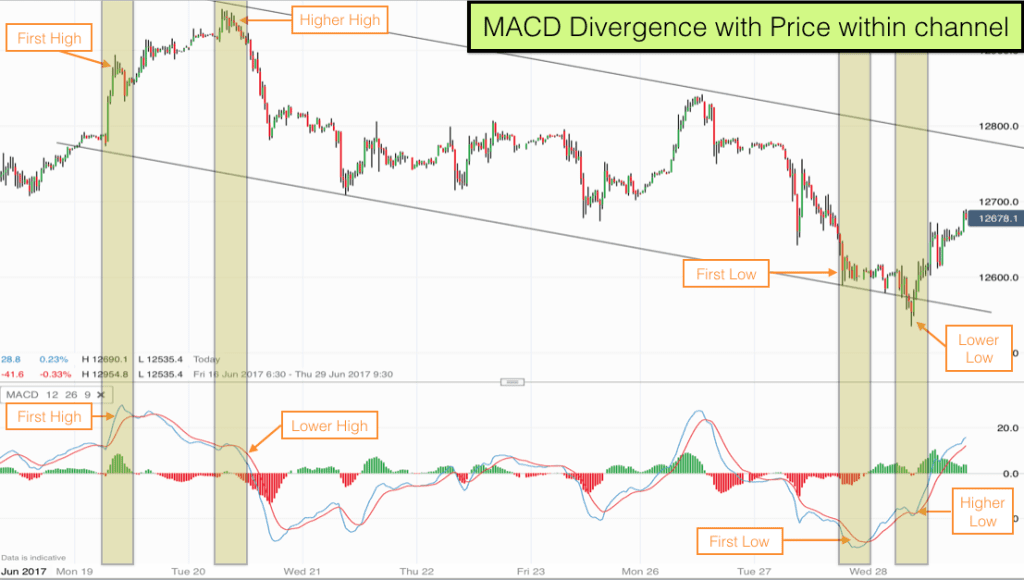
A divergence takes place when the MACD indicator (or any other technical momentum indicator) contradicts price. In this case we have a bullish divergence. The MACD indicator makes a low and then a higher low – indicating that momentum is moving to the upside. At the same time price makes a low and then a lower low.
The MACD indicator is a momentum indicator and is based upon average prices. When it starts moving upwards it is normally the case that price is also moving upwards. In this case the MACD indicator is going upwards and price is continuing to go downwards. This indicates that the market is oversold and therefore a correction is likely.
As you can see from the above chart, the divergence is followed by a sharp upward movement in price as expected.
How reliable is an MACD divergence in indicating a price reversal?
It is always a good idea to look for a confluence of factors prior to taking a trade. An MACD divergence with price event is fairly reliable, however in a strong trend several similar divergences can take place before the reversal gets under way.
So we should look for other factors to confirm that the reversal is likely before taking action.
What other factors may there be?
Often gaining perspective on events can help bring clarity and the same is true in trading. Current price action takes place within a framework of price action on a larger scale, so lets take a look at a bigger timescale to see if we can shed more light on the current situation.
You can see from the above chart that the current price action and MACD divergence takes place on the right of the chart. We have condensed the chart so that we can see the bigger picture.
The bigger picture reveals that we are currently in a bear channel. Price is zigzagging lower. The current divergence has taken place right at the bottom of the bear channel. This provides us with excellent confluence.
Bearish Divergence between MACD and price
On the top left of this chart you can see price peak. This is actually at an all-time high for this particular market.
The price peak here is a bearish divergence between MACD and price. The market makes an all-time high and the MACD indicator below makes a lower high. This is another excellent reversal trade opportunity and you can see for yourself what happened with price after the event.
The confluence here was, bearish MACD divergence and price making an all-time high.
What to look out for in an MACD bullish and bearish divergence
Firstly, it is essential with bullish and bearish divergencies between technical indicators (like MACD, Stochastic, RSI) and price that there is space between the highs and lows.
In both of the examples that I use here there are at least ten price bars between the first high and second high (and first low and second low).
Markets move in waves or legs. Upward wave, downward wave. Upward leg, downward leg. It is important that there is a clear wave or leg between the first high and the second high or first low and second low. When the highs or lows are very close together it may be that the wave or leg is only halfway through and that the market has not yet finished its move.
Secondly, it is preferential that the divergence is absolutely obvious i.e. that there is a big difference between the first high and the lower high or the first low and the higher low on the technical indicator.
 “Outstanding” – 75% Discount & FREE Mindfulness Course with our