The DAX index produced two perfectly tradable triangles on the one minute chart today. I’m going to walk you through the action so that you can spot these trading opportunities for yourself.
Trading ranges mean scalping
The one minute chart requires fast thinking and I use it for scalping. Scalping for me means taking trades that offer a minimum 1:1 risk to reward ratio. With a scalp trade I am looking for the market to produce recognisable chart patterns at good market context levels which trigger quick trades. I am looking for the market to go in my favour pretty much straight away and when it hits my target I exit my trade and bank the profit (rather than waiting to see if the market is offering more).
With any trade offering a 1:1 risk to reward I am looking for high probability. I know that in order to make a consistent profit I must win on at least 60% of these type of trades. Familiar chart patterns in the right context offer this level of probability.
Higher timeframe trading range – Context

Pre-market I will always look at the higher timeframe charts to gain context for my trading on the open.
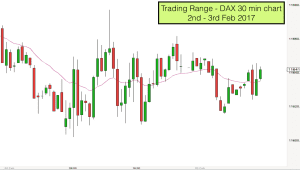
Today we can see that the DAX index was in a trading range on the 30 minute chart (left). Yesterday produced some nice swings from bottom to top of the range and back again. The low of the range was 11600 and the top was 11680.
When I see this type of trading range action I assume the same type of action for today until the market proves otherwise. Markets tend to have inertia and trading ranges can last a long time. Price keeps looking like it is going to break out and then reverses back into the range.
In 30 minute timeframe trading ranges there are a wide variety of trading opportunities on shorter timeframes. Yesterday we illustrated a nice uptrend on the one minute chart which spanned most of this range.
Wedges, triangles and tight trading ranges are prevalent within longer term trading ranges.
You can see on the main chart above that I have one indicator on my chart, the 20 EMA. This is the EMA that I use when the market is in a tight range.
Triangles
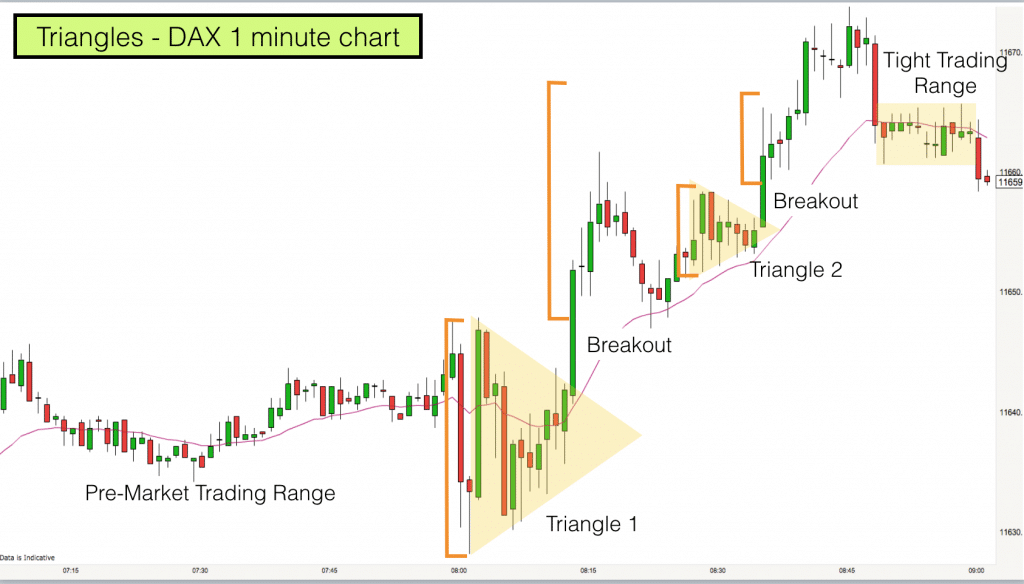
The market opened today and immediately bounced up above and down below the 20 EMA. I was on the look out for a wedge or a triangle. After about ten minutes (10 bars) a triangle emerged.
Triangle appear on price charts when a price squeeze is underway. All traders know that the market is going to breakout in one direction or another from the squeeze and when it does it will likely produce a good 1:1 risk to reward trade. The question is which way will it break.
I waited and watched as the price consolidated. I use the 20 EMA as my guide. Is price above or below the 20 EMA. Often the 20 EMA seems to push price up or down and this can be the precursor to the breakout.
Price approached the upper side of the triangle. It was now above the 20 EMA and rising. Price rejected lower prices below the 20 EMA – it was ready to breakout.
I measured the height of the triangle. This would be my target (see the orange brackets on the chart). I would enter as soon as price broke out above the triangle. Up it went and stopped me into my trade.
Whist in the trade I am keeping an eye on the 20 EMA. I need price to stay above that line in order for the trade to be successful.
You can see from the chart that we had a pullback before price reached my 1:1 target. Where did price move back to? The 20 EMA. On this line price bounced and moved quickly higher. A bull pin bar on the 20 EMA was a good signal that higher prices were likely.
On the way to my target we had an important resistance level, 11650. Price stuck just above this level for a few minutes. I noticed that it was producing another triangle, another price squeeze.
As price was above the 11650 level and consolidating (and above the 20 EMA) I suspected that the 11650 had been accepted and we were likely to breakout higher again. I got ready to enter a second trade. This would be a smaller target with smaller risk, so I adjusted my position size accordingly.
We broke higher from Triangle 2 and within five minutes both targets had been hit and I was out of my trades.
The market rose a few more points and peaked at 11670, which was almost the top of the longer term trading range. Two excellent scalp trades within the first one hour of market action.
Learn to trade price action and chart patterns with our Day Trading & Swing trading Training Course.

