Wedges are a common trading chart pattern. They are not always obvious and it takes some practice to pull them out of the price action on a chart, however they can be a good indicator that a change of momentum is likely.
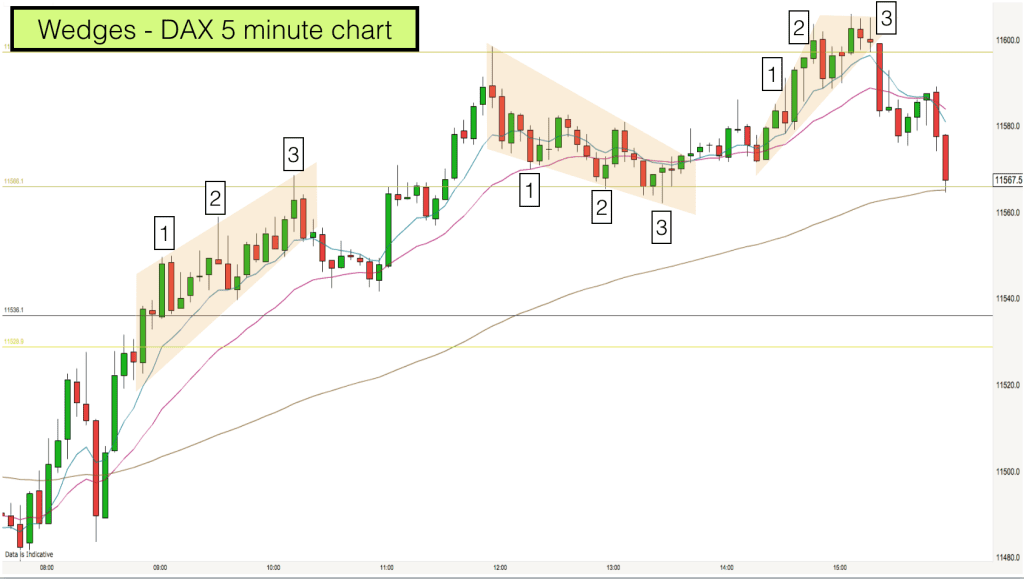
We are looking at the five minute timeframe on the DAX index here from the 7th Feb 2017. I was actually trading the 1 minute timeframe, however the wedges are easier to see on the 5 minute timeframe in this case.
In the chart above you can see three wedges. Each of the wedges had three pushes in the overall direction of the wedge and this is a common occurrence. They were each followed by a move in the opposite direction to the wedge which happens roughly 75% of the time.
A wedge can be identified by plotting lines across the top and bottom of spikes within a range. When the lines are parallel then it is a trend channel. In these cases you can see that the lines diverged and expanded (rather than being parallel), giving us our wedges.
Wedge – chart pattern 1
Starting in the bottom left of the chart we can see that the market broke out higher from the open (8am). We then had a deep pullback which took us back to the opening price level and rebounded.
We then broke higher once more and an uptrend started was confirmed.
On the chart we have three moving averages, the 90 bar, 20 bar and 8 bar EMAs. Price rose above each of these levels and so that is how we know that we are in an uptrend.
You can also see that we have a number of horizontal green and black lines on our chart, which are support and resistance levels. In a trend we can expect to see price move steadily through these levels after a short pause and they normally serve as an opportunity for pullback trades rather than reversal trades. You can see after the open the market did reverse temporarily at the first Support & Resistance line, this was the first pullback. It then powered through the same level on the bounce higher after a very brief pause. This pause formed the beginning of our wedge.
At this stage in the trend I assume that we are in trend channel phase. Moving higher with small pullbacks. We can see the price continually bouncing off the 8 EMA on the way up. Each move higher offers the opportunity for a scalp trade long.
Wedges often have three pushes
In any trend channel I am always looking for three pushes. In uptrends three pushes upwards. In downtrends three pushes downwards. Whenever we have three pushes we have some kind of wedge.
Wedges can have more than three pushes and often the third push in the direction of the trend is followed by some kind of pullback. This give me a chance to exit my with-trend trade at a good price when I see price pulling back after three with-trend pushes.
In this case we did have three pushes upwards before a pullback to the 20 EMA. We can observe from the chart that the third push upwards hit the support and resistance level before producing a reversal candlestick bar.
Trend resumption
In most uptrends the first pullback to the 20 EMA is bought. It was in this case. At 11am we had a bull reversal bar pushing up above the 20 EMA and this was the cue for the market to resume the uptrend.
Again our support and resistance levels signalled the end of this leg of the trend. We had a bearish pin bar at the key level of 11600. This formed the beginning of our second wedge. This time the wedge was a pullback wedge.
Pullback Wedge – 2
We got three pushes down from the current high of the day and the third push took us down to another key support and resistance level.
Importantly at this stage we still hadn’t lost touch with the 20 EMA. We had an EMA gap bar and then the trend resumed with a move up and out of the second wedge.
This is another great example of the proprietary trend template from our online trading course working perfectly. First pullback to the 20 EMA, second deeper pullback leaving an EMA gap bar and then the market creating a higher high.
With-trend Wedge – 3
The third wedge was formed as the market made the new highs. Again we had three pushes upwards. Price briefly broke the 11600 level with the third push upwards but there was no conviction in the move and a bearish engulfing candle took us down from the highs of the day. This was where the majority of bulls exited their long trades and it signalled the end of the trend for the day.
I hope that you found this analysis useful and interesting. If you would like to read the markets and trade for a living then I would be delighted for you to join us on our Day Trading & Swing Trading training course.

