Over the last two mornings we have seen very contrasting trading conditions in the German stock market, the DAX.
Yesterday, on the 13th of February 2017 we had a persistent bull trend which lasted all day. Today the market has been in a tight trading range all morning.
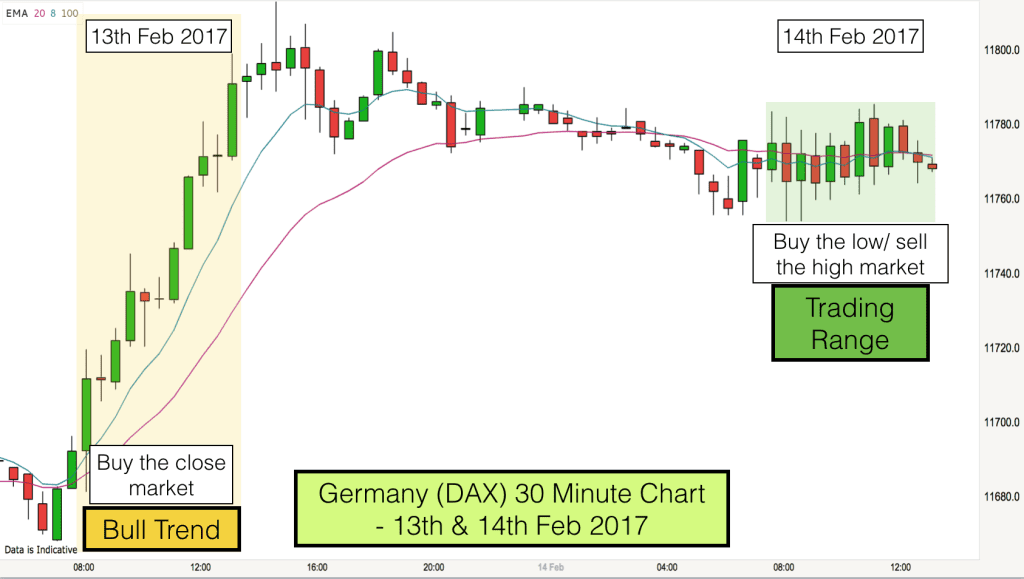
These two markets as shown in our diagram above illustrate the need to be able to read price action and develop flexible trading systems in order to be profitable in the market.
The 13th of Feb morning action is in the yellow box. The 14th of February action is in the green box. In the yellow box almost every bar is a bull bar. In the green box every green bar is followed by a red bar.
On our charts we have the 8 (blue line) and 20 (red line) EMA indicators. You can see how, in trends, the market tends to use these indicators to represent value. On the 13th of February traders bought the market at every opportunity whilst the price was above the 8 EMA.
This day was a buy the close day. On the 30 minute chart above you can see how buying the close of each 30 minute candlestick bar would have been profitable right up to 1pm when the market reached its target price of 11800.
[
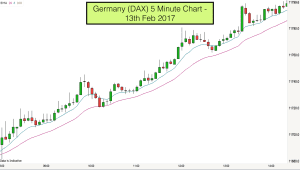
Dax 5 minute chart 13th February 2017Indeed you can see the same price action on the 5 minute chart above. The blue 8 EMA line stayed above the 20 EMA line all morning. Every time the price dipped below the 8 EMA on this timeframe traders bought the market. This is quite a rare market. The candlesticks are relatively small for the DAX (which tends to be volatile).
This was a great day for momentum traders and a simple day to trade for most. The market was going up so we could profit simply by buying the market at any stage and holding the trade until it was profitable and hit target.
On trending days like the above momentum indicators like Stochastic and RSI spend the whole day going in and out of overbought conditions and producing bearish divergencies. Indicators like this do not work in this type of market.
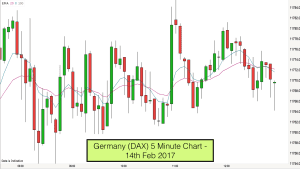
Now lets take a closer look at the trading action on the 14th of February. Would the same buy and hold trading tactics work?

The answer is no, most definitely not! The day after a very strong bull trend we have a very tight trading range. Completely different trading conditions requiring very different trading tactics.
On days like this the 8 and 20 EMAs are completely useless. Trading EMA crosses would have been a loss making strategy. Buying and selling when price crosses the EMAs would have been loss making. Buying and selling price bounces off the EMA would have been loss making.
Tactics for trading in a trading range
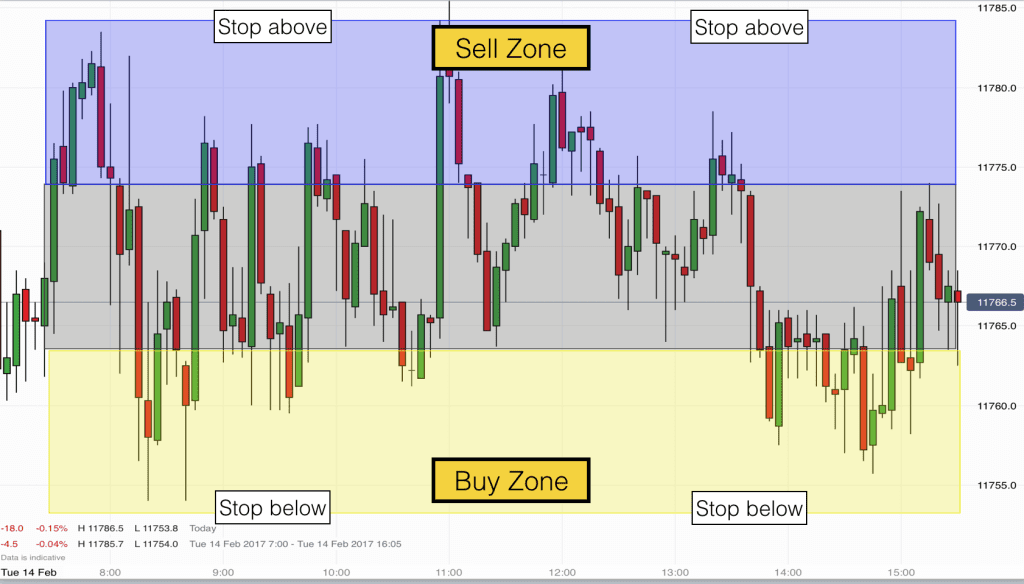
The only strategy that works consistently when price is in a tight trading range like this is to spilt the price range into three segments. Top third, middle third and bottom third. When price enters the top third and produces a small bar then sell or sell above the high of any bar. When price enters the lower third and produces a small bar then buy or buy below the low of any bar. This is buying low and selling high.

Scalp trades are the only winning strategy in trading ranges. 1:1 risk to reward is normally about as good as we get and this is ok because probability is high that a reversal or fade trade will work. The probability is in favour of tight reversals. 80% of breakouts from trading ranges fail.
It is a challenging strategy emotionally because when price is rising the brain says “buy” and when the market is falling the brain says “sell”. Doing the opposite seems crazy but it is exactly the tactics that pro traders use and if we want to be profitable then we must do what the pros are ding.
Again in tight trading ranges momentum indicators are all but useless. There is no momentum after all.
Learn to read price action
One of the key skills that pro traders possess is being able to read market conditions. Market conditions will dictate trading tactics. In order to trade successfully we need to be able to read the market and read price action. A one system fits all solution does not work in trading. We need to be flexible with our trading strategy and trade according to the market conditions that prevail.
In trends 80% of attempts to reverse the trend will fail and in trading ranges 80% of breakouts will fail – markets have inertia. We need to structure our trades accordingly, take good risk to reward trades and respect the market.
Learn to read price action and different market conditions in our Day Trading and Swing Trading training course.

